Carol Johnston
Introduction
This technical note provides the data from recent FCGR tests on modern S355ML steel. The tests in solution were carried out for the Carbon Trust Offshore Wind Accelerator (OWA) Foundations Technical Working Group (TWG), as part of TWI project number 35660 (LCCA – Quantifying Corrosion: Lifecycle Corrosion Condition Assessment and Fatigue Performance Project). The Carbon Trust TWG has given permission for the results to be shared with the BS7910 committee for inclusion in future re-analysis of FCGR data.
Background
The fatigue crack growth rate (FCGR) laws in BS7910 are used by operators to calculate expected fatigue life of cracked structures. They were derived based on analysis performed by King (1998) of data from “structural and pipeline steels with a yield stress of ≤450MPa, and other weldable steels with a yield stress greater than 450MPa.”. The datasets were grouped based on the stress ratio (R) used during the tests (either R 0 to 0.1, and R≥0.5. Data from tests at R<0 was excluded), and the test environment. Test environments were air and immersed in simulated seawater under free corrosion conditions (SW), and also in simulated seawater with cathodic protection (SW+CP). The FCGR tests conducted in SW or SW+CP were performed at a frequency of 1Hz or less, with most of the tests performed at 0.1 – 0.2Hz, because this is a typical wave frequency in the North Sea. The test solution was simulated seawater (either 3.5% NaCl or ASTM D1141 solution) at temperatures representative of the North Sea (typically 4 oC and 10oC).
King (1998) performed regression analysis on the datasets to calculate values of the constants and slope of the region of the curves represented by the Paris law, resulting in equations for FCGR (da/dN) of the form:
where A and m are constants, and ΔK is the stress intensity factor range.
It was found that two-stage curves provided the best fit for the experimental data, and so constants are provided for Stage A (the near threshold region) and Stage B (the higher ΔK values). BS7910 provides constants for both the mean and upper bound (ie mean + 2 SD, where SD is the standard deviation of the measured FCGR) two-stage FCGR curves for test conditions of R<0.5 or R≥0.5, in air, SW and SW+CP. The FCGR constants for the BS7910 mean curves under conditions of R≥0.5 and air and SW are summarized in Table 1. The mean SW FCGR curve is a factor of 1.7 above the mean air curve at ΔK of 220N/mm3/2 anda factor of 3.6 at a ΔK of 900N/mm3/2.
Materials and methods
A programme of FCGR tests was carried out on specimens extracted from 85mm thick plates of Grade S355ML steel. The measured yield strength of the steel was 346MPa.
Single edge notched bend (SENB3) specimens measuring 10 x 20 x 110mm were extracted from the plates. A notch was made by electrodischarge machining (EDM) to a depth of 2mm, and a precrack of 2mm was made at a stress ratio of 0.5.
Fatigue crack growth rate tests were conducted in air at ambient temperature at a frequency of 10Hz, and also while specimens were immersed in 3.5% NaCl solution at 5oC and 10oC. Test frequencies of 0.2, 1 and 10Hz were used. For tests performed in simulated seawater, specimens were first pre-soaked for a period of 48 hours. No lacquer was applied to the specimen surfaces.
A stress ratio of 0.5 was used for all tests. In all tests, crack length was monitored using direct current potential drop (DCPD) and the DCPD reading was used as an input to the computer that controlled the applied loads in order to maintain a constant ΔK during the tests.
The tests in air were increasing ΔK tests. The tests in solution were frequency scanning tests, where ΔK was held constant and the test frequency was changed after each 1mm of crack growth. Three ΔK values were used (250, 400 and 800 N/mm3/2).
Results
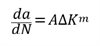
The results are provided in Tables 2 and 3 and plotted in Figure 1, along with the BS7910 R≥0.5 mean air and SW FCGR curves.
The results from the tests in solution included in this analysis were those obtained at a test frequency of 0.2Hz and 1Hz and a test temperature of 5oC and 10oC, to aid comparison with the BS7910 values.
It is clear that the mean FCGR of the new test results, which were obtained R = 0.5, is below the mean R≥0.5 FCGR laws in BS7910.
Comparing the experimental mean curves with the BS7910 air and free corrosion in SW mean curves:
- The free slope and forced slope mean FCGR curves in air were coincident and the slope matched that of the BS7910 mean in air curve.
- The air BS7910 R>0.5 FCGR curve was a factor of 1.5 higher than the measured mean air curve.
- The free and forced slopes of the mean SW results were different.
- Using the free slope experimental mean curve, the mean SW BS7910 R>0.5 curve was a factor of 2.9 above the measured SW curve at a ΔK of 220N/mm3/2 anda factor of 2.5 above the BS7910 SW mean at a ΔK of 900N/mm3/2.
Comparing the measured air and SW mean curves, it can be seen that the mean air and SW FCGR curves were coincident at a ΔK of 220N/mm3/2 ie there was no measured acceleration in FCGR due to the simulated seawater environment at this value of ΔK. At ΔK of 900N/mm3/2, the SW mean FCGR was a factor of 2.4 higher than in air (using forced slopes) and a factor of 2 higher than air using free slopes.
Comparing with the original database used to generate the crack growth laws for R>0.5 given in BS 7910, the air data generated lie on the lower side of the dataset, but within the scatter. With regards to the frequency scanning data generated in freely corroding simulated seawater, these data also lie within the scatter of the dataset, especially those data produced at a frequency of 0.2Hz.
Summary
- The mean FCGR of the modern S355ML steel tested was lower than the mean BS7910 FCGR curves, both in air and freely corroding in 3.5% NaCl.
- The measured acceleration in FCGR caused by free corrosion in 3.5% NaCl was less than that of the BS7910 mean curves.
Recommendation
These data should be combined with other data from modern steel and welds and the larger dataset re-analysed to ensure that the FCGR laws in BS7910 are representative of the performance of modern welds and modern steels.
Figure 1: Comparison of test results with the BS7910 R≥0.5 air and free corrosion curves.
|
R
|
Stage A
|
Stage B
|
Stage A/Stage B transition point ΔK, N/mm3/2
|
|
Mean curve
|
Mean curve
|
Mean curve
|
|
Freely corroding in seawater
|
|
≥0.5
|
5.37x10⁻¹⁴
|
3.42
|
5.67x10⁻⁷
|
1.11
|
1098
|
|
-
|
Air
|
|
≥0.5
|
4.80x10⁻¹⁸
|
5.10
|
5.86x10⁻¹³
|
2.88
|
196
|
Table 1: BS7910 FCGR law constants of the mean curves and R ≥0.5.
|
Specimen ID code
|
Frequency, Hz
|
Temperature, oC
|
ΔK N/mm^3/2
|
FCGR (mm/cycle)
|
|
M01-1
|
0.2
|
5
|
253.8
|
2.27E-06
|
|
M01-2
|
0.2
|
5
|
253.4
|
3.44E-06
|
|
M01-3
|
0.2
|
10
|
253.0
|
3.99E-06
|
|
M01-4
|
0.2
|
10
|
253.2
|
3.72E-06
|
|
M01-2
|
1
|
5
|
254.0
|
2.83E-06
|
|
M01-1
|
1
|
5
|
255.0
|
2.82E-06
|
|
M01-3
|
1
|
11
|
255.3
|
2.93E-06
|
|
M01-4
|
1
|
10
|
254.4
|
3.00E-06
|
|
M01-1
|
0.2
|
5
|
412.1
|
1.88E-05
|
|
M01-2
|
0.2
|
5
|
407.8
|
1.83E-05
|
|
M01-4
|
0.2
|
10
|
410.0
|
2.04E-05
|
|
M01-2
|
1
|
5
|
409.4
|
1.35E-05
|
|
M01-1
|
1
|
5
|
413.1
|
1.54E-05
|
|
M01-3
|
1
|
10
|
412.3
|
2.51E-05
|
|
M01-4
|
1
|
10
|
412.2
|
1.44E-05
|
|
M01-1
|
0.2
|
5
|
834.7
|
2.44E-04
|
|
M01-2
|
0.2
|
5
|
820.5
|
2.29E-04
|
|
M01-3
|
0.2
|
10
|
834.1
|
2.09E-04
|
|
M01-4
|
0.2
|
10
|
833.6
|
3.48E-04
|
|
M01-2
|
1
|
5
|
826.3
|
1.57E-04
|
|
M01-1
|
1
|
5
|
834.4
|
1.79E-04
|
|
M01-3
|
1
|
10
|
838.3
|
1.83E-04
|
|
M01-4
|
1
|
10
|
836.9
|
1.61E-04
|
Table 2: Results from tests performed in 3.5% NaCl at 4oC and 10oC and 0.2 and 1Hz.
|
Specimen
|
ΔK
|
da/dN
|
|
(N/mm3/2)
|
(mm/cycle)
|
|
M01-11
|
465.7
|
1.66E-05
|
|
478.1
|
1.93E-05
|
|
486.4
|
2.02E-05
|
|
495.3
|
2.26E-05
|
|
506.4
|
2.51E-05
|
|
515.3
|
2.82E-05
|
|
525.7
|
2.92E-05
|
|
534.4
|
3.30E-05
|
|
M01-10
|
286.0
|
4.62E-06
|
|
291.9
|
4.96E-06
|
|
295.8
|
5.26E-06
|
|
300.1
|
5.62E-06
|
|
305.3
|
5.92E-06
|
|
313.9
|
6.14E-06
|
|
315.4
|
6.26E-06
|
|
321.1
|
6.50E-06
|
|
328.7
|
6.96E-06
|
|
331.6
|
6.93E-06
|
|
334.8
|
7.33E-06
|
|
342.8
|
7.88E-06
|
|
346.1
|
7.93E-06
|
|
350.5
|
7.99E-06
|
|
353.8
|
8.28E-06
|
|
362.1
|
8.74E-06
|
|
364.7
|
8.94E-06
|
|
370.4
|
9.48E-06
|
|
376.0
|
9.67E-06
|
|
380.8
|
9.80E-06
|
|
388.7
|
1.06E-05
|
|
393.2
|
1.09E-05
|
|
397.3
|
1.12E-05
|
|
402.3
|
1.16E-05
|
|
411.5
|
1.21E-05
|
|
414.4
|
1.27E-05
|
|
420.0
|
1.32E-05
|
|
426.2
|
1.37E-05
|
|
432.9
|
1.41E-05
|
|
438.3
|
1.50E-05
|
|
438.6
|
1.53E-05
|
|
450.8
|
1.58E-05
|
|
455.0
|
1.71E-05
|
|
464.3
|
1.73E-05
|
|
469.5
|
1.86E-05
|
|
477.4
|
1.82E-05
|
|
481.1
|
1.98E-05
|
|
488.3
|
2.12E-05
|
|
496.4
|
2.16E-05
|
|
503.1
|
2.30E-05
|
|
509.7
|
2.37E-05
|
|
517.6
|
2.54E-05
|
|
526.7
|
2.66E-05
|
Table 3: Results from tests performed in air.
References
BS 7910:2019: ‘Guide to methods for assessing the acceptability of flaws in metallic structures’ British Standards Institution, London
King R. A, 1998: ‘Review of fatigue crack growth rates in air and seawater’. HSE Report OTH 511. London: Health and Safety Executive Books, 1998. ISBN 0-7176-2413-7. <http://www.hse.gov.uk/research/othpdf/500-599/oth511.pdf>