Design S-N curves in fatigue design rules such as BS 7608 [1] and DNVGL-RP-C203 [2] were generated by statistical analysis of large sets of data. There is inherent scatter in fatigue test data, and this scatter is described well by the Normal distribution. As such, design curves were defined, located two standard deviations of LogN below the mean, corresponding to a 97.7% probability of survival.
From a statistical point of view, the best way to show that welds made using a new procedure belong to the same dataset as that used to derive the standard S-N curve (ie qualify to a particular class) is by testing a large number of welds (>40). This is obviously impractical. Instead, a smaller number of welds (eg six) can be tested and the target curve approach can be used to determine whether a new welding procedure has fatigue performance in-line with a particular standard S-N curve. This uses statistics to take account of the uncertainty associated with comparing the mean of a small dataset (the test results) with the mean of a large dataset (the standard S-N curves from the design standards).
For the tested welds to qualify to a particular standard S-N curve, the mean of the test results must be above the target curve (illustrated in the Figure, from [4]). This shows that the test data belongs to the same population as that used to derive the original standard S-N curve, at a particular level of statistical confidence. Note that it is not necessary for each individual data point to exceed the target curve, only the mean of the dataset.
At a particular stress range, the target is calculated as follows (this example is for a 95% confidence level) [3]:
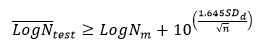
where BS 7608 defines these as:
 = mean logarithm of the endurance of the test results.
LogNm = log-endurance of the mean standard S-N curve.
1.645 = the percentage point of a normal distribution for a probability of 0.95.
SDd = standard deviation of the standard S-N curve.
n = number of fatigue test results at a particular stress range.
Since, by definition, the design curve is two standard deviations below the mean curve, if the results are being compared to a standard design curve1, then the target curve is calculated as:
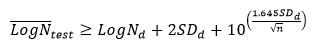
where LogNd is the log-endurance of the design standard S-N curve.
References
- BS 7608+A1, 2014: ‘Guide to fatigue design and assessment of steel products’, British Standards Institution, London.
- DNVGL, 2016: ‘DNVGL-RP-C203, Fatigue design of offshore steel structures’ Det Norske Veritas, Norway.
- Schneider C R A and Maddox S J, 2003: ‘Best practice guide on statistical analysis of fatigue data’. TWI Core Research report 13604.01/02/1157.02, July. https://www.twi-global.com/technical-knowledge/best-practice-guides/statistical-analysis-of-fatigue-data/. Also issued as IIW document number Doc IIW-XIII-WG1-114-03
- Johnston C, 2017: 'Statistical analysis of fatigue test data' OMAE2017-62212, 36th International Conference on Ocean, Offshore and Arctic Engineering.
1 BS 7608 provides both mean and design S-N curves, while DNVGL-RP-C203 provides only design curves. The standard deviation applied to all of the DNVGL S-N curves is 0.2.
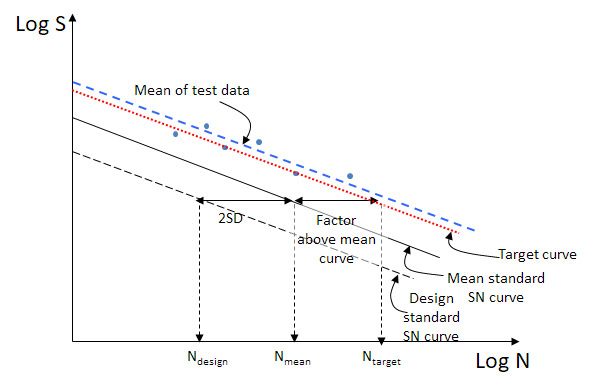
Figure S-N curve demonstrating that the test results qualify to the standard S-N curve because the mean of the test results is above the target curve.