Wed, 24 November, 2021
The Wrapsense Project’s 6-month large-scale environmental tests concluded and the results have now been assessed.
The testing involved installing WrapSenseLD technology on a representative steel pipe, which was then exposed to 6 months of winter weather with the aim of validating sensor performance under environmental loading and correlate slight sensor disturbances with the relevant weather information.
The pipe was a 10-metre long, 300mm OD steel pipe that was fitted with ten 1-metre long sensors connected to an Internet of Things controller unit that provided data transmission from the sensors and reported readings hourly. In addition, a wireless weather station was set up to assess weather conditions and any environmental damage to the sensor readings.
WrapSense Data
The system collected data from 1 January to 30 June 2021 as shown in Figure 1 (below), which uses colours to show the unprocessed signal data from the 10 sensors during this time. The near vertical slopes represent hydrocarbon detection tests, which were removed from the data to normalise the signal for each sensor. These normalised, processed signals were used for the sensor performance assessments.
In addition, the period from 9-14 June shows a time when the WrapSenseLD system disconnected from the cloud service and started beeping constantly. This issue was communicated by TWI to project partners Direct-C and a battery replacement was performed.
The six months also included five other short offline periods, which were due to system updates (attended or remotely via the cloud). Each update required a system restart, which caused a spike on the voltage signal. These spikes were removed from the analysis. There was also a period from 1-11 January where sampling was taken daily rather than hourly, as was the case for the rest of the testing period.
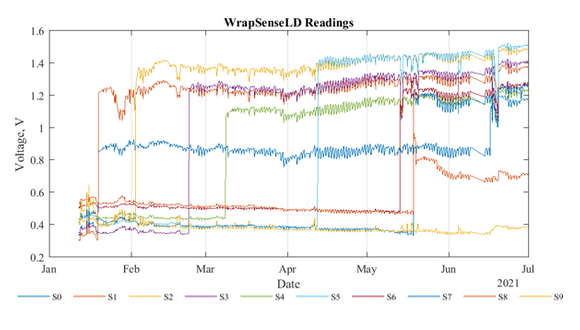 Figure 1. Unprocessed WrapSenseLD 6-month readings
Weather Station Data
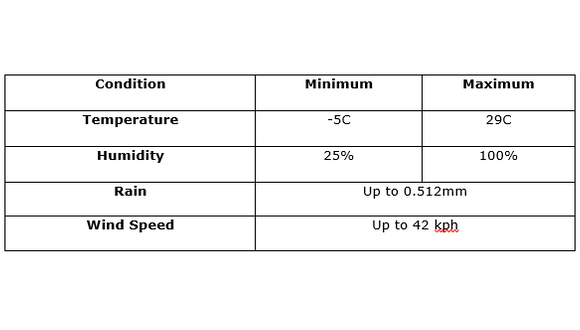
The weather station recorded the temperature during the six months in °C, with figure 2 (below) showing the increase in both the maximum and the minimum temperatures from 21 March onwards. However, as the minimum temperature didn’t increase at the same rate as the maximum temperature, the delta of temperature across each day increased, which could affect sensor performance. The maximum temperature recorded was 29°C on 14 June at 13:45 and the minimum was -5°C on 11 February at 2:00.
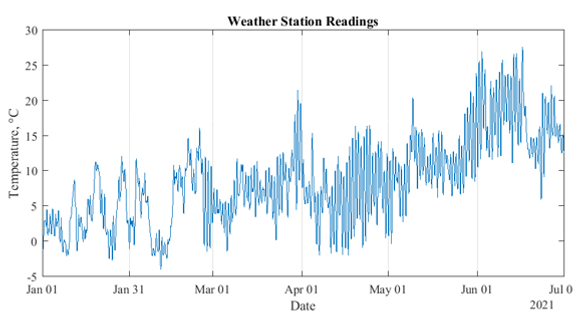 Figure 2. Temperature recordings - 6 months
In addition, the weather station measured the relative humidity (Figure 3), and rain in millimetres (Figure 4) during the six months of testing. May 2021 was the wettest month on record according to a UK MET Office report. Finally, the wind speed was measured in kilometres per hour (Figure 4). Because wind is complex to measure and varies due to vegetation growth and topography there was no trend evident across the six months.
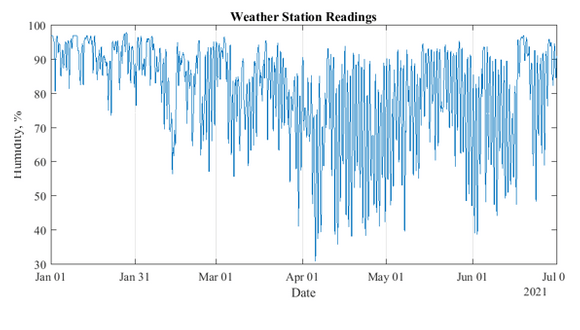 Figure 3. Humidity recordings - 6 months
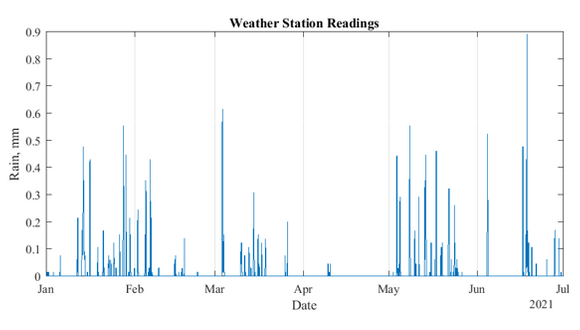 Figure 4. Rain recordings - 6 months
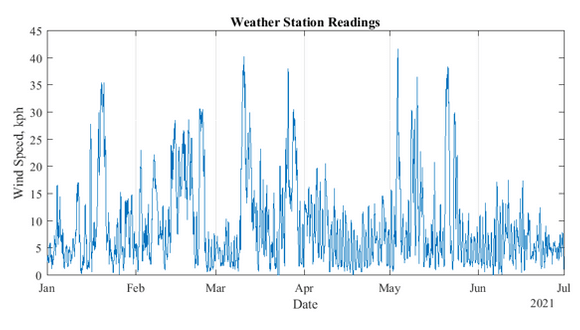 Figure 5. Wind speed recordings - 6 months
Data Correlation for Periodic Variables
The data from the various signals were divided by month and then auto-correlated on a 15-day lag. The weather data was also auto-correlated across the six months and the final humidity and temperature data was cross-correlated with the WrapSenseLD data. Figures 6 and 7, for example, show the cross-correlation between the WrapsenseLD data for sensor 4 against temperature and humidity respectively.
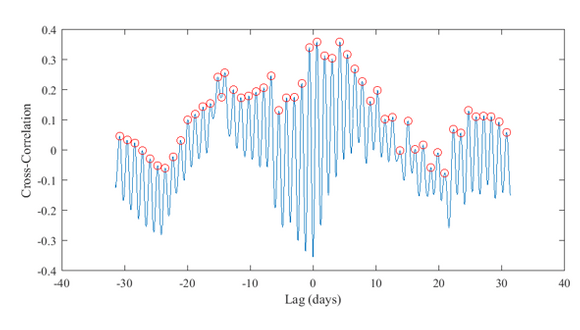 Figure 6. WrapSense S4 cross correlation with Temperature
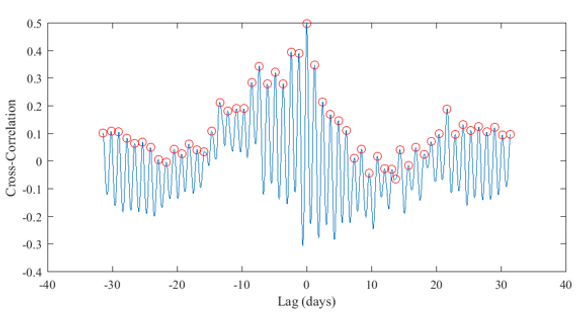 Figure 7. WrapSense S4 cross correlation with Humidity
Figure 8 shows an example of the cross-correlation of Normalised WrapSense Sensor 4 data compared with normalised humidity data from 25 May to 1 June. As for humidity, the WrapSense response is on-phase, which means that the sensor’s maximum oscillating values coincide with the maximum relative humidity that occurs at night. Conversely, during the day, when the humidity drops to a minimum shortly after noon, the sensor’s response is also at a minimum value.
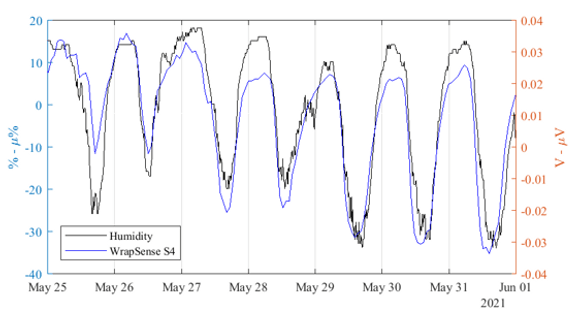 Figure 8. Normalised WrapSense and Humidity data
Data Correlation for Non-Periodic Variables
Non-periodic variables such as rain and wind speed were assessed, with two instances of more than 0.3mm of rainfall being analysed to determine if there was an impact on sensor response. The results showed that sensor oscillation was briefly interrupted by the rainfall but the mean values remained at normal levels following the rain and oscillation according to temperature and humidity also returned to normal. This demonstrated a slight impact as a result of the heavy rainfall, but the operation went back to normal, as shown in figure 9 (although sensor 1 shows an unrelated drift that began before the rain).
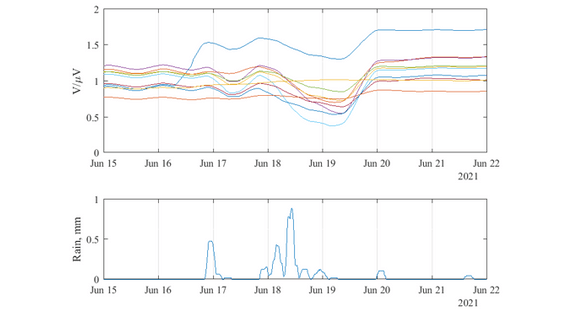 Figure 9. Example rain event and delayed response analysis
Finally, the WrapSense performance assessment showed that there was no noticeable disruption to functionality for wind speeds of 42 kilometres per hour.
Conclusions
After completing Work Package 5, the following conclusions were drawn:
- WrapSense technology is highly sensitive to liquid hydrocarbons rendering it a low-cost, simple, flexible, reliable technology for oil and gas industry leakage detection
- The WrapSense polymer nanocomposite coating’s sensitivity was not affected by the environmental variables over a 6-month exposure on a representative UK site
- WrapSense voltage signal oscillations are periodic on a daily basis
- WrapSense’s sensor performance appears to mirror relative humidity behaviour regarding phase, signal shape, amplitude and periodicity
- None of the environmental variables triggered false alarms over 6 months data
- WrapSense sensors were sensitive and operational across the following environmental conditions:
The Wrapsense Project is funded under InnovateUK Project Number 105611