Condition Monitoring of Large Structures using Piezoelectric Transducers
S. M. Williams
TWI Limited, Cambridge, UK
Paper presented at EVACES '07 (Experimental Vibration Analysis for Civil Engineering Structures), 2nd International Conference, Porto, Portugal, 24-26 October 2007.
Abstract
This paper describes an experiment to investigate the feasibility of condition monitoring large industrial structures by modal testing with piezoelectric transducers to excite and detect the lower order modes of vibration. The work was part of a programme of research part funded by the EC within the fifth framework program GROWTH under the short name 'Piezodiagnostics'. The paper focuses on work at TWI describing experiments to demonstrate the principle on aboveground storage tanks (ASTs).
The work showed that the generation of the modal response of a scale model AST using piezoelectric transducers was possible under laboratory conditions. Modification to the wall of the AST, representative of typical structural damage, was identifiable by prominent changes in the normalized frequency response spectrum. The presence of vertical butt welds in the tank wall had a significant influence on the measured response, a factor that could in principle beex-ploited to locate damage.
1 Introduction
The work described in this report was conducted at TWI and jointly funded by the TWI corporate research programme (CRP), and partly by the EC through a 5th framework project called 'Piezodiagnostics' [EC, 2005] The project consortium had nine partner companies from the UK, France, Poland and Spain. Piezodiagnostics was part of the EC GROWTH programme, its duration was three years and it lasted between 2002 and 2005 (visit www.cordis.lu/ for details).
The identification of structural modification in large structures is generally difficult without full access, which is not always possible. Structural degradation due to corrosion tends to be slow and progressive. Once damage grows beyond a critical size catastrophic failure can occur suddenly, hence there is a need to identify and monitor its course. Lamb waves, which exist at frequencies between tens and hundreds of kilohertz in steel, are increasingly being used for long range monitoring. Their main advantage is that they can be propagated over substantial distances with minimal attenuation. The success of Lamb waves for pipe-work inspection owes much to the prismatic properties of this type of structure. For non-prismatic structures such as storage tanks, however, attenuation due to beam spread and scattering is a serious drawback and consequently no commercial systems based on this technology are currently inexistence. The Piezodiagnostics project was dedicated to the development of a novel concept. The principle is that by reducing the testing frequency to that of structural vibrations, scattering can be reduced still further, leading to much longer testing ranges than those achievable with Lamb waves. Furthermore, the approach used in this project was to excite with piezoelectric rather than electromechanical devices. Consequently, the amplitude of vibrations generated and detected is much smaller. Such low amplitude microscopic vibrations require much less energy to induce in the structure, are intrinsically safe and represent a realistic and practical approach to the condition monitoring of large industrial structures. The project consortium has named this concept 'PD' (PiezoDiagnostic) technology.
The Piezodiagnostics project was dedicated to the development of the concept that piezoelectric transducers could be used to both excite and detect lower order modes of vibration in large industrial structures. These frequencies are lower than Lamb waves making longer testing ranges possible. Furthermore the amplitude of vibrations is much smaller than that conventionally used for testing at these frequencies. Such low amplitude vibrations require much less energy to induce in the structure, are intrinsically safe and represent a realistic and practical approach to the condition monitoring of large industrial structures. The PD principle was validated on pipes by other Piezodiagnostics project partners [EC, 2005] but this paper describes research conducted at TWI to apply the technique to tanks. Above ground storage tank (AST) inspection presents an enduring challenge to testing engineers and provided an excellent case study for the application of PD technology to large industrial structures.
2 Aims
The aims of this research were 3-fold:
- To validate, using the AST case study, the concept that piezoelectric transducers could be used to excite and detect lower order modes of vibration in a large industrial structure.
- To demonstrate that typical structural change could be detected using microscopic vibrations generated and detected by piezoelectric transducers.
- To demonstrate a capability to locate structural change in large industrials structures using piezoelectric excitation and detection of lower order modes of structural vibration.
3 Experimental approach
The main approach was to obtain the modal response of a model tank wall by conducting a stepped frequency scan and comparing the fingerprint generated under different configurations (locations of transducers) and in different tank states (location of structural modification). In a stepped frequency scan the excitation frequency is changed in steps of a fixed size. At each frequency, a steady state sinusoidal structural response, of the same frequency as the excitation, is established and measured simultaneously at a number of locations on the structure. At a natural frequency (otherwise known as a mode) of the structure, the structural vibrations reinforce (constructive interference) and a large response is measured. The resolution of the stepped scans was 0.1Hz. Structural modification was simulated by added mass (see section 4.2).
The frequency response function (FRF) was used for fingerprint analysis. It is defined as:
(1)
The actuators were state of the art piezoelectric transducers that operate at low frequencies in either tensile or compressive mode. The force was measured by a sensor located in an impedance head. The measured force varies according to the instantaneous acceleration, its peak magnitude being dependent on the dynamic structural loading. The response was measured by four sensors that were sensitive to local deformation. A conventional FRF is derived from displacements, velocities or accelerations and therefore, strictly speaking, the sensors do not measure the true FRF. However, it is reasonable to assume that some proportionality exists between radial displacement and local distortion in the region of the sensor. This being the case then the transfer FRF derived from the sensors will exhibit the characteristics of an FRF acquired by conventional measurements. The sensors, being separate from the force sensor, each generated a transfer FRF (sensor response divided by force measured at impedance head).
This paper describes experiments to evaluate PD technology for monitoring tank walls as a demonstration of its capability for condition monitoring large structures in general. Techniques for monitoring the tank floor were explored but are not reported here as the data were inconclusive.
4 Equipment and apparatus
4.1 Model Tank
The model tank was designed and built at TWI. It consisted of a 4m diameter tank with a bottom plate comprising two 6mm thick semi-circular plates of steel. The plates were butt-welded together and a 1 metre high shell consisting of three sections was fillet welded to the bottom plate. The three sections were themselves butt-welded together. The bottom plate was trimmed to leave a rim of 100mm. The whole tank was treated with a bituminous coating. While not being an exact scaled replica, this design still represented some basic tank features such as the shell, fillet weld, rim and butt welds. The tank was mounted on sand to simulate the foundation materials used in practice.
4.2 Added masses
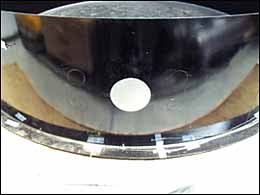
In this research added masses represented structural change. At the long wavelengths used in these experiments a structural change such as the failure of a stiffener or localized corrosion primarily reduces the local mass or stiffness causing changes in the dynamic properties. An equivalent increase in mass will cause local stiffness increase and comparable changes in the dynamic properties. Therefore added mass was considered a valid way of demonstrating the potential to detect typical degradation of a large structure and was more convenient as it could be made reversible. The attached mass is illustrated in Figure 1. It was a circular steel disc 2.5mm thick and of 26cm diameter. It was attached to the tank wall with fast setting epoxy.
4.3 Transducers
The sensors supplied by CEGELEC were prototype piezo-ceramic devices whose output voltage was proportional to the local surface deformation. The basic structure of this type of sensor is shown in Figure 1. The sensor was attached with a layer of fast-acting HBM X60 epoxy. The actuators supplied by CEDRAT were amplified piezo-actuators (APA). These were employed to excite the tank's structural vibration response. The basic structure of an APA is shown in Figure 1. The actuator works by pulling its two opposite ends together in response to an applied voltage within the range -20V to 150V, which is generated by the conditioning unit in response to an order signal between -1V and7.5V. The voltage causes the bar of piezo-ceramic material between the poles to extend. Once the voltage is removed the actuator returns to its original shape.
4.4 Testing apparatus
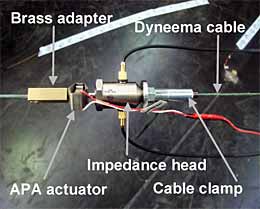
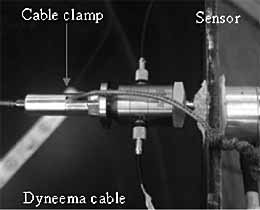
The tank wall was excited with the active-tendon configuration. Each end of the actuator was connected to an adapter that interfaces it with a Dyneema cable (made by Eurocord BV). This material was chosen because it was lightweight and therefore the effects of self-weight would be negligible. The cable is attached to the tank wall with a cable clamp. A tension of approximately 100N was applied by pulling the cable through the clamp with a hanging weight gauge.
|
With plate attached mass
|
Active tendon (tank centre)
|
 |
 |
|
Active tendon (tank wall)
|
Piezo-ceramic actuator
|
|
|
 |
|
Fig.1. Tank monitoring apparatus
|
The actuator suspended in the centre of the tank and the actuator wall mounting is shown in Figure 1. The two positions of the impedance heads allowed verification that the force produced by the actuator was the undistorted order signal transmitted through the cable to the tank wall.
Figure 2 illustrates the different testing configurations and tank states. In the 'active tendon' configuration there were two possible locations of the cable. These were either configuration AT1 or AT2 depending on whether the actuator's cable was connected to location 1 or location 2. Both locations were across diameters of the tank and were at right angles to the each other. The results from AT1 are omitted for brevity. They were generally similar to those presented below for AT2. 'a', 'b' and 'd' represent three separate locations of the attached mass. Please note that the same mass was either attached at either location 'a' to give state W(a), location 'b' to give state W(b) or location 'd' to give state W(d). At no time was more than one mass attached to the tank.
Fig.2. Plan view of tank states and testing configurations (not to scale)
5 Experimental procedure
To test the PD concept on the AST application a range of stepped scans were conducted exclusively using the piezoelectric actuators and sensors. The experiments are summarized in Table 1. In this table lower case letters indicates location on wall (W) and 'As new' means no attached mass. The scan step size was 0.1Hz in all cases.
Table 1: Summary of tank wall experiments (configuration AT2)
| Experiment No | Tank state |
|---|
| 1 |
As new |
| 2 |
W(a) |
| 3 |
W(b) |
| 4 |
W(d) |
| 5 |
As new |
In the first four experiments, scans were performed between 1Hz and 200Hz at a frequency resolution of 0.1Hz. The scan of the unmodified tank was repeated in experiment 5. Each scan lasted approximately one hour.
6 Results and discussion
6.1 Repeatability of stepped frequency scans
Experiment 1 and experiment 5 were repeat scans of the tank wall with no modification. Examples of the FRFs for each experiment are overlaid in Figure 3(a) (sensor 2). The results for the other sensors are omitted for brevity. Note that in this figure the 100Hz to 200Hz range is stacked above the 1Hz to 100Hz range with an arbitrary offset. Note also that the repeat scans were taken two weeks apart. Between the first and second experiment, the actuator cable was disassembled and then reassembled and re-tensioned. The scans indicated good qualitative agreement between repeat experiments. There did not appear to be any difference in the repeatability between the upper and lower frequency ranges. The closest agreement appears to be in the frequencies of the modal peaks. The amplitudes of the peaks are noticeably more variable,although not excessively so. However it is worth pointing out an exception to this. A small peak appears at 97Hz in the FRF of sensor 2 for one experiment but not the other.
Nevertheless, these results have demonstrated the concept that piezoelectric transducers could be used to excite and detect the lower order modes of vibration in a large industrial structure such as an AST.
6.2 Sensitivity to added masses
Experiment 2, experiment 3 and experiment 4 were scans of the tank wall with modification 'W(a)', 'W(b)' and 'W(d)' respectively. These FRFs are overlaid for sensor 2 in Figure 3(b). The results for the other sensors are omitted for brevity. Note that in this figure the 100Hz to 200Hz range is again stacked above the 1Hz to 100Hz range with an arbitrary offset. Note also that in this figure W(a), W(b), W(c) and W(d) are represented by state 'a', state 'b' and state 'd' respectively. All three scans were taken over a period of one week.
The first point to note is that, below 140Hz, there is very little difference between the scans for the modified tank (with the single exception of the 90Hz mode at sensor 2 when the tank had modification W(a)). In other words there is generally no sensitivity to structural change below 140Hz. However, between 140Hz and 200Hz there is clearly more difference between the modified states, i.e. the higher frequency range discriminates between locations of structural modification better.
Between 196Hz and 200Hz there were dramatic indications on the spectra of the tank modified with 'W(b)' and 'W(d)' on all sensors but particularly on sensor 2. In some cases, most notably sensor 2, the change in amplitude was verypronounced. The modal amplitudes in this region of the spectrum for states W(b) and W(d) are 12 times the amplitudes in the unmodified state.
Inspection of the 100Hz to 200Hz frequency band reveals that, while the spectra of the tank wall in states W(b) and W(d) are similar to each other, that of state W(a) differs noticeably from both of them. In fact the spectrum ofW(a) is very similar to that of the unmodified tank, suggesting that there was less sensitivity to this modification than for states W(b) and W(d) (there were nevertheless subtle indications of the mass in location 'a' such as the shift in frequency at the mode at 181.2Hz). The explanation for this lies in the symmetry of the tank wall. Figure 2 shows that in state 'd' and state 'b' the mass has approximately the same unequal displacements from the vertical butt welds (~106cm and ~313cm). However, in state A the displacements are approximately equal (156cm:162cm). The response to the modification is dependent on its relative proximity to the welds. As this does not appear to be the case below 100Hz one may assume that in this frequency range the welds do not play an appreciable role in the vibration and the wall vibrates as a continuous sheet.
a) Repeat scans on unmodified tank (measurements taken 15 days apart)
b) Scans on tank modified with 1kg attached mass at A, B and D
Fig.3. Tank wall FRFs at Sensor 2 for stepped frequency scan (0.1Hz step)
The mode shapes are harmonics of the first ovalisation mode and adopt a standing sinusoidal waveform with amplitude varying from maximum at the top to zero at the bottom of the wall. In addition the excitation force vector suppresses those modes that are not symmetrical about the cable. This property is exhibited all around the whole structure and hence also by the sensors and is characterized by the relative phases of all of the sensors being either0° or 180°. The natural frequencies are called real normal modes of vibration. Figure 4 shows the unmodified tank time histories for modes at 63.7Hz and 82.1Hz ( Fig.3). The phase of sensor 2 is matched with sensor 3 and the phase of sensor 1 is matched with sensor 4 in both cases. This restriction is imposed by the force vector that is generated by the cable. The force vector does however permit sensors 1 and 4, to be either in phase (mode at 63.7Hz) or out of phase (mode at 82.1Hz) with sensors 2 and 3.
Fig.4. Time histories for the unmodified tank showing phase relationships of real normal modes: a) Mode at 63.7 H; b) Mode at 82.1Hz
However, above 100Hz the dynamic properties of the welds are different from the parent material and the wall does not vibrate as a continuous sheet. At these frequencies the spatial model of the tank wall can no longer be approximated as uniform. The differences in the damping properties of welds compared with the parent material will produce local variations in the phase at higher frequency modes. These natural frequencies are called complex normal modes of vibration and are characterized by the relative phases of at least one of the sensors being neither 0° nor 180°. In this experiment it was generally exhibited by modes above 100Hz. Note that the phase relationship looks and behaves like a traveling wave, even at and near the amplitude peak. This is a characteristic of the complex mode. [Ewins, 2001] The time histories of the mode at 181Hz ( Fig.3) are illustrated in Figure 5. Here it is clear that there is a degree of complexity in the relative phases of the response at each sensor and this is a property of non proportional damping caused by the welds as previously discussed.
However, more significantly, over the 140-185Hz range the force spectrum exhibited large amplitude fluctuations when the tank was either in state 'b' or in state 'd'. Figure 6 illustrates this phenomenon. These features are not obvious on the response spectra yet on the force spectra they represent prominent indications of the modification. At the lower frequencies where the tank wall vibrates as a continuous sheet the anti-nodes can be expected to always be at the excitation point. However, at frequencies where the properties of the welds differ from the parent material the position of the anti-nodes and nodes become independent of the excitation location l. The force spectrum between 140-185Hz appears to be 'flatter' than below 100Hz because at the modes of vibration the excitation point is not an anti-node so the amplitude fluctuations are of lower amplitude. At locations 'b' and 'd' the attached mass appears to be effective in suppressing several modes of vibration above between 140-185Hz. This is shown by the response amplitude being generally reduced and there are corresponding 'spikes' in the force spectrum. As well as suppressing modes between 140-185Hz, modification 'b' and modification 'd' also give rise to a new modal peak between 196-200Hz and this corresponds to the minimum indicated in Figure 6. The spectral peak is large than other peaks because the force at this minimum is closer to zero that all other modes. A possible explanation is that the modification brings about a mode with an anti-node at the excitation point in this frequency range and that the force is lower because there is less modal damping at these frequencies. The fact that the force and response spectra produce no sensitivity to the mass attached at location 'a' suggests that midway between the welds there is little sensitivity to this structural modification over the whole frequency range.
Fig.5. Time histories for the unmodified tank showing phase relationships of complex normal mode
The reductions in response amplitude between 140Hz and 185Hz together with the sharp rise in amplitude are features commonly observed by noise and vibration engineers. Here the introduction of a structural modification to reduce vibration in a particular frequency range often gives rise to a new mode at another frequency (which does not represent a problem provided that the new mode is outside the operational frequency range). For condition monitoring the new mode is a valuable indication provided it falls within the scanned frequency range as is clearly the case here.
Fig.6. Force measured at excitation point for different tank states
The results have shown that it was possible to detect structural change on the tank by modal testing with piezoelectric transducers. Location of structural modification is possible by exploiting a numerical model to predict the dependence of the response on modification position relative to the welds.
Further experimentation is required to verify these results under operational conditions, particularly when the tank is in various states of fill. The prominence of the indications suggests that structural modification smaller than50% wall thickness change is detectable and the next stage would be to validate the technique with a 25% change in local wall thickness. Further tests are also planned on the tank floor to adapt the technique for use on heavily damped structures.
7 Conclusions
- The concept of using piezo-electric transducers to excite and detect the lower order modes of vibration in a large industrial structure was successfully validated for above ground storage tank (AST) walls under laboratory conditions.
- The presence of simple structural modifications was detected by changes in the response spectrum and the force spectrum.
- The capability of this method to locate a structural modification has been demonstrated by the dependence of the structural response on the proximity to vertical welds in the wall of the tank.
8 References
- European Community project funded under the 'Competitive and Sustainable Growth' Program. 'Smart Structural Diagnostics Using Piezo-Generated Elastic Waves (PIEZODIGNOTICS)'. January 2005. Final Report. Visit cordis.europa.eu/
- D. G. Ewins. Modal Testing: Theory, Practice and Application. Mechanical Engineering Research Studies Engineering Design Series. Taylor & Francis Group 2001. ISBN 0 86380 218 4.